What is Topological Data Analysis? - A Primer
On this page we describe an example topological data analysis scheme. Here, alpha shapes are the type of simplicial complex chosen, which have the advantage of at highest having the ambient space dimension. Thus, we only have to deal with comparably small complexes, making this approach computationally efficient.
A pedagogical introduction to the corresponding numerics is given in a separate numerical tutorial, in which respective C++ code is detailed which implements the approach presented here.
From point cloud to Delaunay complex
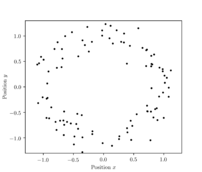
The point cloud that we use to catch a glimpse of the topological data analysis machinery is the one displayed in the linked Figure: Data points lying on an approximately circular shape in two-dimensional space, though somewhat noisy. In general, any finite set of points [math]X=\{x_1,\dots, x_n\}\subset \mathbb{R}^d[/math], [math]d[/math] integer, is suitable for topological data analysis.
The first step in a topological data analysis routine is to generate a simplicial complex from the given point cloud. A simplicial complex is, roughly speaking, a combination of points from the point cloud, of edges connecting always two of the points, of triangles, tetrahedrons and higher-dimensional simplices, following certain combinatorial rules.
Among the many types of complexes available, the Delaunay complex and related alpha shapes turn out to be computationally very useful[1]. The first step in its theoretical construction is the Voronoi diagram,
[math]\textrm{Vor} (X) = \bigcup_{i=1}^n \big\{y\in \mathbb{R}^d \, \big|\, ||y-x_i||\leq ||y-x_j|| \, \forall \, j\in \{1,\dots,n\}\big\}.[/math]
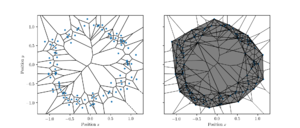
The Voronoi diagram consists of a Voronoi cell, polygonal in shape, around each of the data points [math]x_i[/math]. Whenever the boundaries of two Voronoi cells intersect, an edge connecting the two corresponding data points [math]x_i[/math] and [math]x_j[/math] is added to the Delaunay complex. Whenever the boundaries of three Voronoi cells intersect, a respective triangle is added and so forth until the ambient space dimension [math]d[/math] is reached. In the linked Figure the Voronoi diagram is displayed on the left-hand side, while on the right its dual, the Delaunay complex is shown.
From Delaunay complex to alpha shapes
A notion of the size of a simplex is introduced by assigning to a simplex the radius of its unique circumsphere. For example, through three points which do not lie on one and the same straight line a unique circle can be drawn. The radius function maps the respective triangle to the radius of this circumcircle.
A means to discriminate features of different sizes in the data is to construct sublevel sets of the radius function to a given radius [math]r[/math]. The resulting object is called alpha shape of the point cloud to the radius [math]r[/math] and consists of all those simplices which have radius smaller than or equal to [math]r[/math]. In the linked Figure alpha shapes of a point cloud to different radii are displayed.
From alpha shapes to persistent homology
Typically, topological features such as multiple connected components, loops or enclosed voids arise in the complexes of interest, as can be observed already in our example: Upon increasing the radius [math]r[/math] topological features may arise in the complex, which at a higher radius get closed again by higher-dimensional simplices appearing in the complex, cf. the linked Figure. The smallest radius of the former type is called the birth radius [math]r_b[/math] of a topological feature, the highest of the latter type its death radius [math]r_d[/math]. In general, topological features may be classified by their persistence, i.e. their birth and death radii. The mathematical construction to accomplish this is persistent homology: Given a nested sequence of complexes, over which range in the sequence do topological features (so-called homology classes) exist?
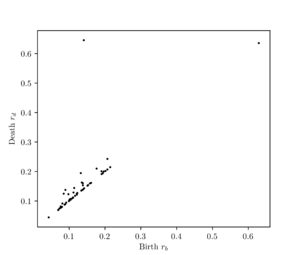
Using persistent homology, it is possible to describe how dominant topological features are in the point cloud of interest. Features that persist over a long range of radii dominate the overall appearance of the point cloud, while features with a small persistence typically appear as noise on the overall shape of the point cloud. In the linked Figure the persistence diagram of the example alpha shapes is given. Displayed in the bottom-left corner of the diagram, quite some homology classes are born at small radii and die at comparably small radii again. This can be interpreted as reflecting the noise added to the circular data. One homology class in the upper-right corner gets born at a large radius, but dies again immediately. However, there is one homology class that is born early, [math]r_b\approx 0.15[/math], and dies late at around [math]r_d\approx 0.65[/math]. This homology class represents the circular structure immanent to the point cloud.
Bearing in mind possible applications to scientific data, persistent homology allows for discriminating actual features in data from noise, as can be seen already from this simple example.
References
- ↑ Otter, Nina, et al. A roadmap for the computation of persistent homology. EPJ Data Science, 2017, 6. Jg., Nr. 1, S. 17. doi:10.1140/epjds/s13688-017-0109-5


